How to Use Desmos on the SAT: The Complete Cheat-Code Guide
How to Use Desmos on the SAT: The Complete Cheat-Code Guide
The College Board handed every SAT test-taker a graphing calculator and most students don't know what to do with it.
Since the SAT went digital in 2024, a full Desmos graphing calculator has been built directly into the test interface — available on every single math question, no exceptions. Students who treat it like a basic calculator are leaving serious points on the table. Students who learn to use it graphically can solve questions in 15 seconds that would otherwise take 3–4 minutes of algebraic work.
This guide covers exactly what Desmos can do on the SAT, which question types it eliminates, and the specific techniques that turn it from a nice-to-have into a genuine scoring weapon.
What Desmos actually is
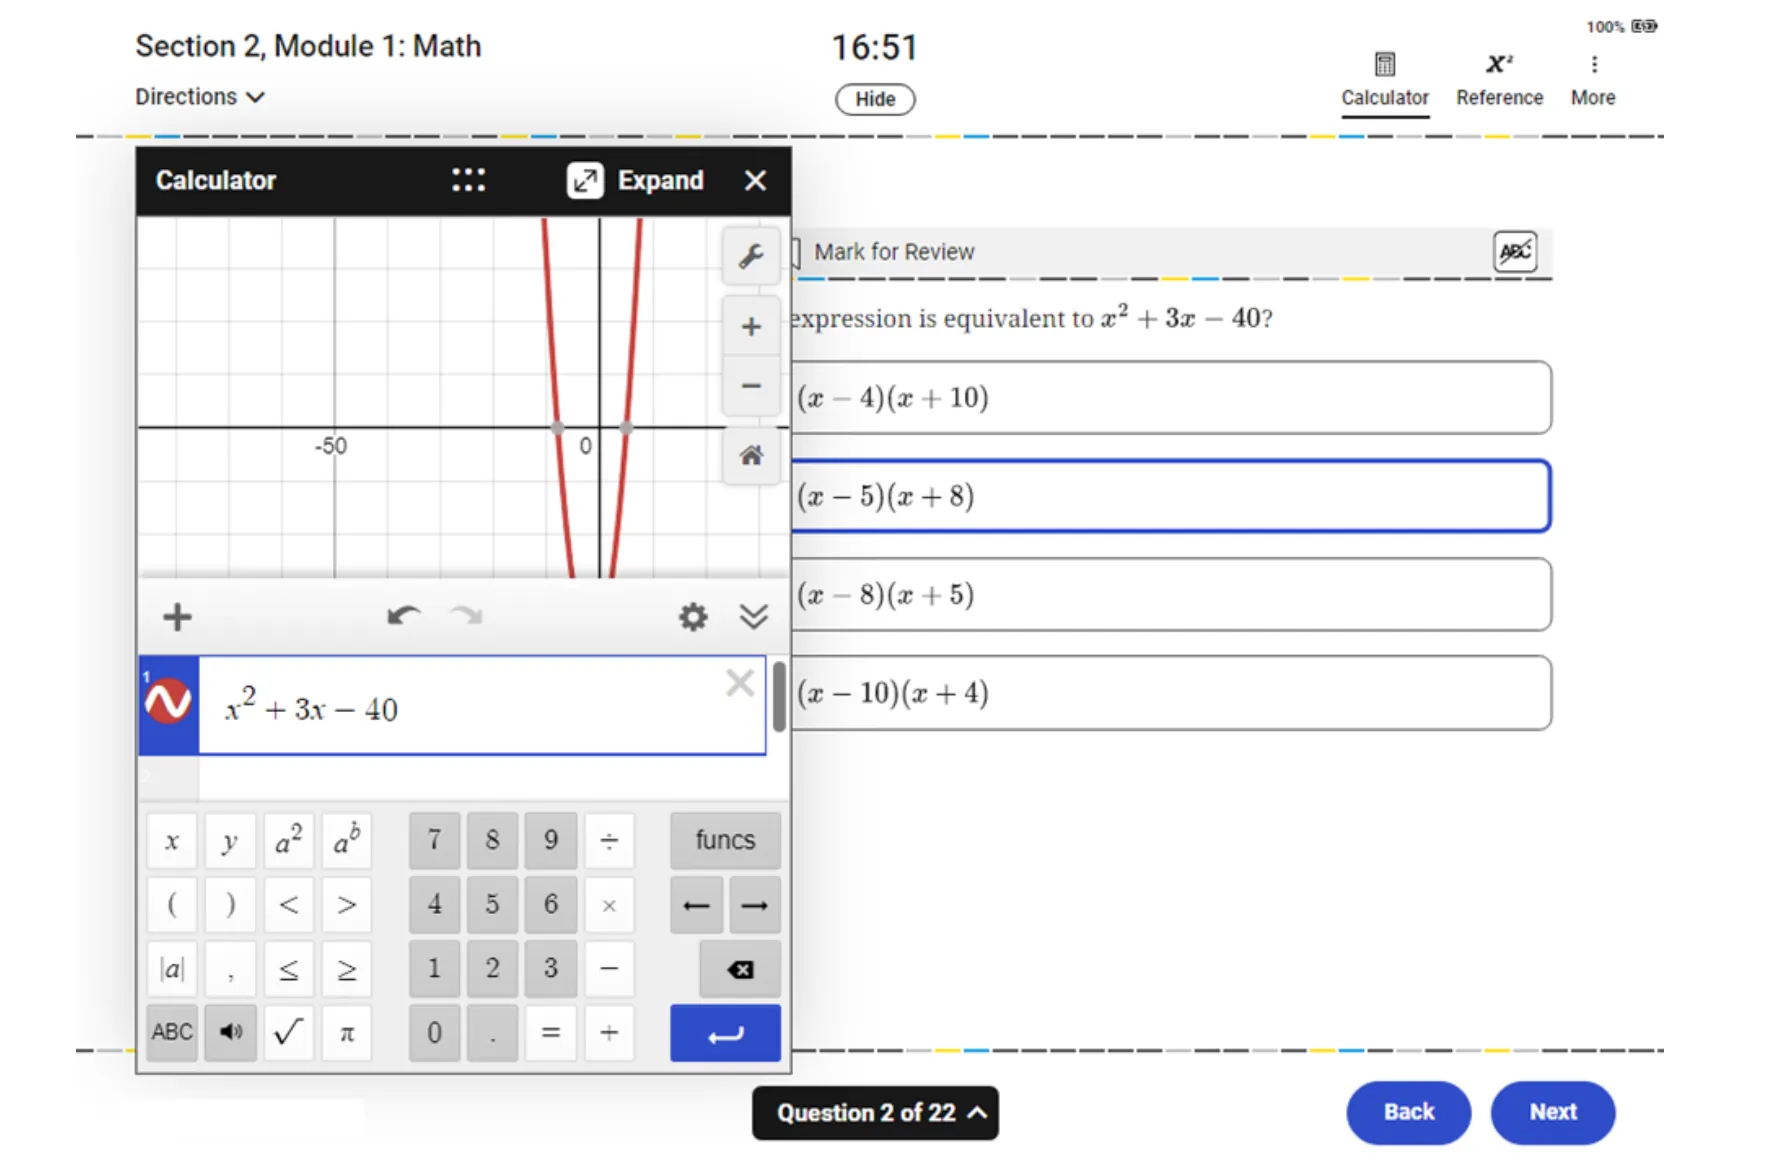
Desmos is a free, browser-based graphing calculator. On the digital SAT, it's embedded directly in the Bluebook interface — you access it by clicking the calculator icon in the top-right corner of any math question. It opens in a panel alongside the question so you can see both simultaneously.
It can:
- Graph any equation or inequality you type
- Find intersection points between curves
- Identify roots, maxima, and minima
- Evaluate functions at specific values
- Graph multiple equations simultaneously and compare them
- Handle arithmetic, fractions, exponents, and radicals
It cannot:
- Solve symbolic algebra for you (it graphs, it doesn't rearrange)
- Work between modules — each module starts fresh
The key insight is this: Desmos doesn't solve equations the way you learned in class. It solves them visually. You type the equation, look at the graph, and read the answer. That's often faster and more reliable than algebraic manipulation, especially under time pressure.
The core technique: graphing to find answers
The most powerful way to use Desmos on the SAT is to graph the equation (or equations) in the question and read the answer directly from the graph.
Here's the fundamental workflow:
- Type the equation from the question into Desmos exactly as written
- Look at the graph — identify what the question is asking (roots? intersection? vertex? y-intercept?)
- Click on the relevant point — Desmos labels coordinates automatically
- Match that coordinate to the answer choices
That's it. No algebra required.
The six question types where Desmos dominates
1. Systems of equations (linear and nonlinear)
This is Desmos's single biggest advantage on the SAT.
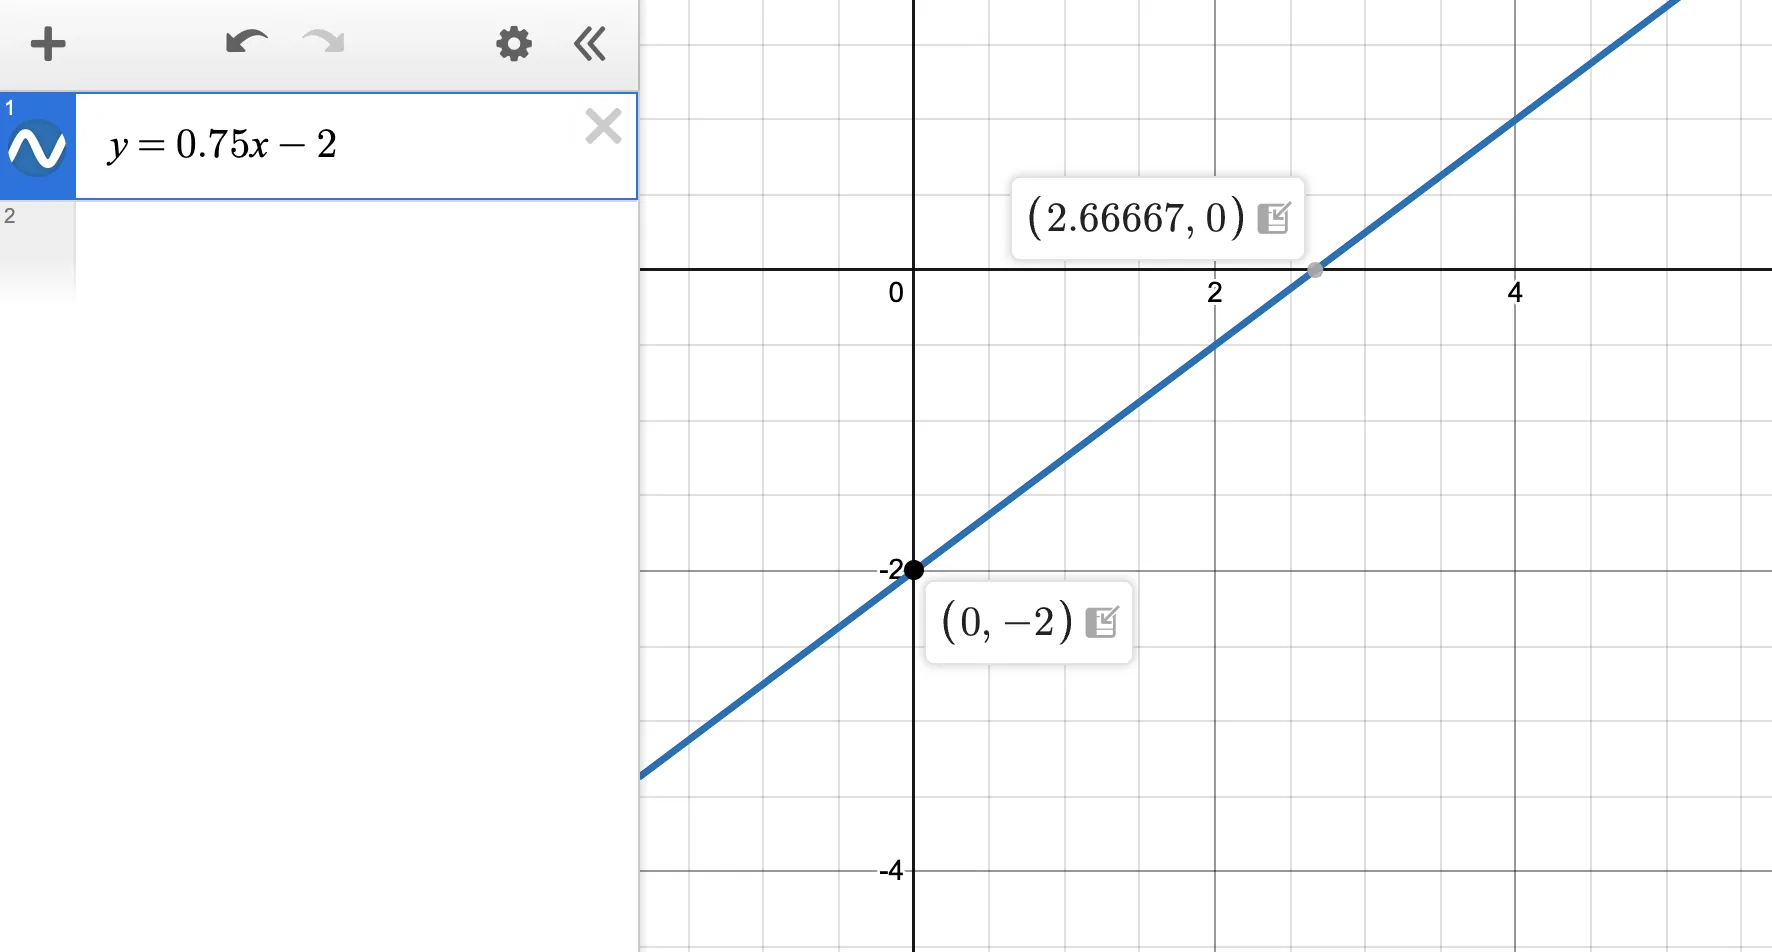
Linear systems solved algebraically take 2–3 steps. Graphed in Desmos, you type both equations, click the intersection point, and read the (x, y) coordinates. Total time: under 20 seconds.
Nonlinear systems — where a line intersects a parabola, or two curves meet — are where algebra becomes genuinely painful. Substitution leads to a quadratic, which you then need to factor or use the quadratic formula on. The whole process can take 3–4 minutes with multiple opportunities for error.
In Desmos: type both equations, click both intersection points, read the coordinates. Under 30 seconds.
Example question type:
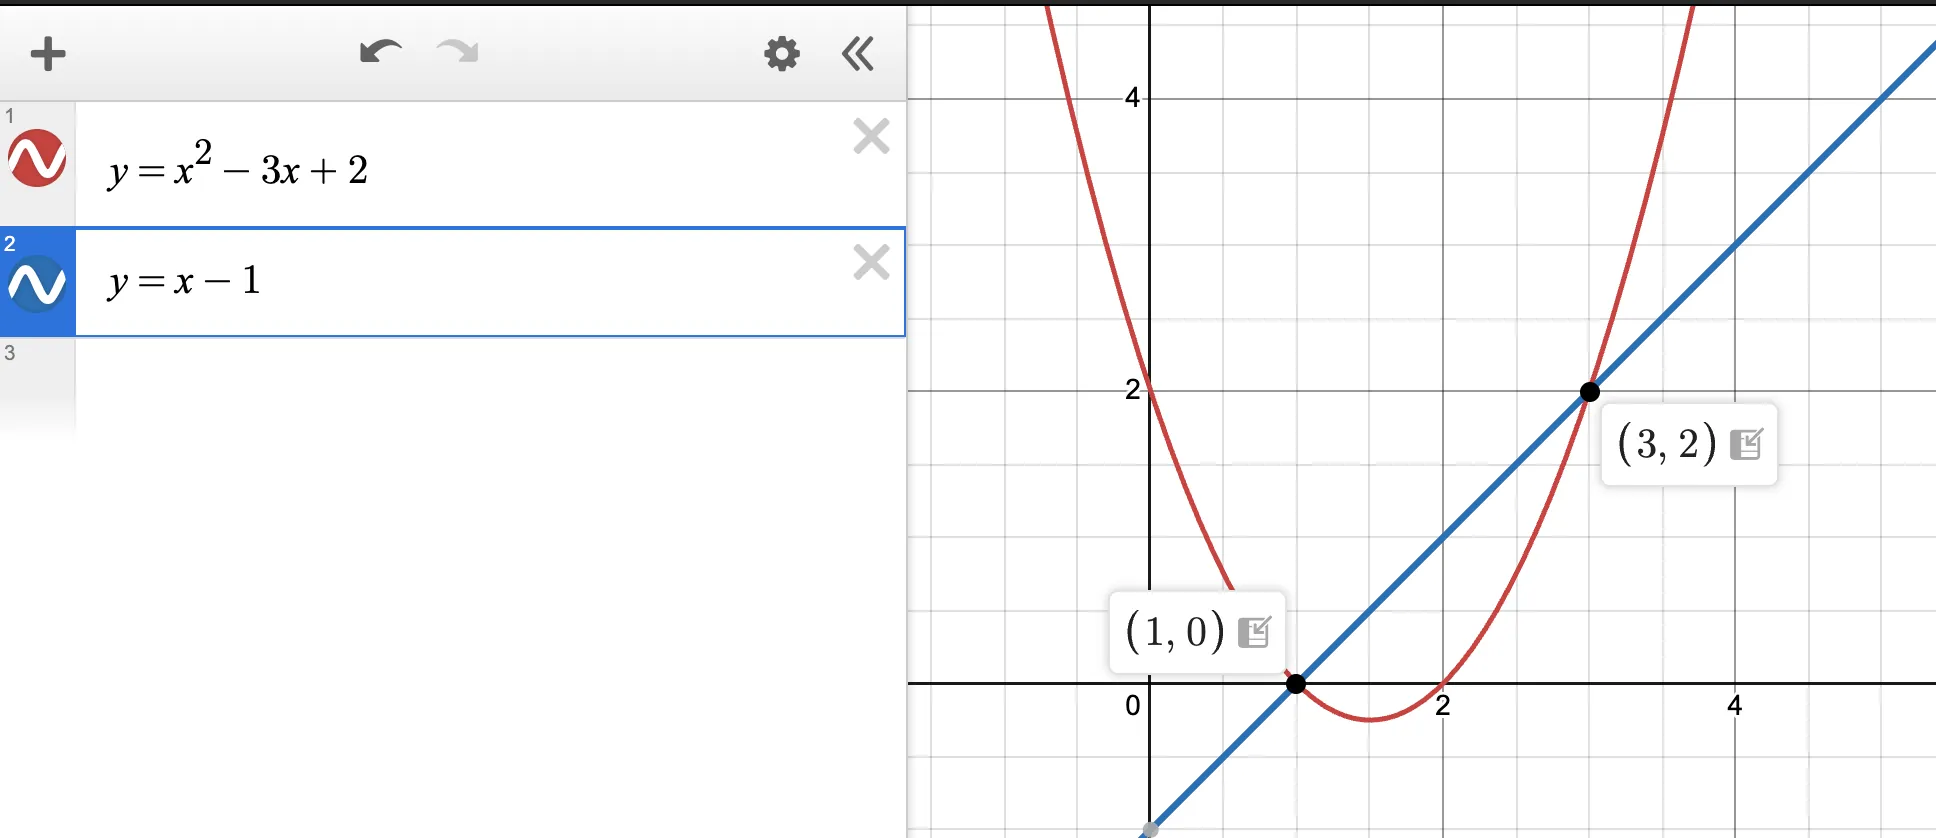
How many solutions does the system y = x² − 3x + 2 and y = x − 1 have?
Type both into Desmos. Count the intersection points. Done.
2. Quadratic roots and zeros
Given a quadratic equation, finding where it crosses the x-axis means finding the roots — which algebraically requires factoring or the quadratic formula.
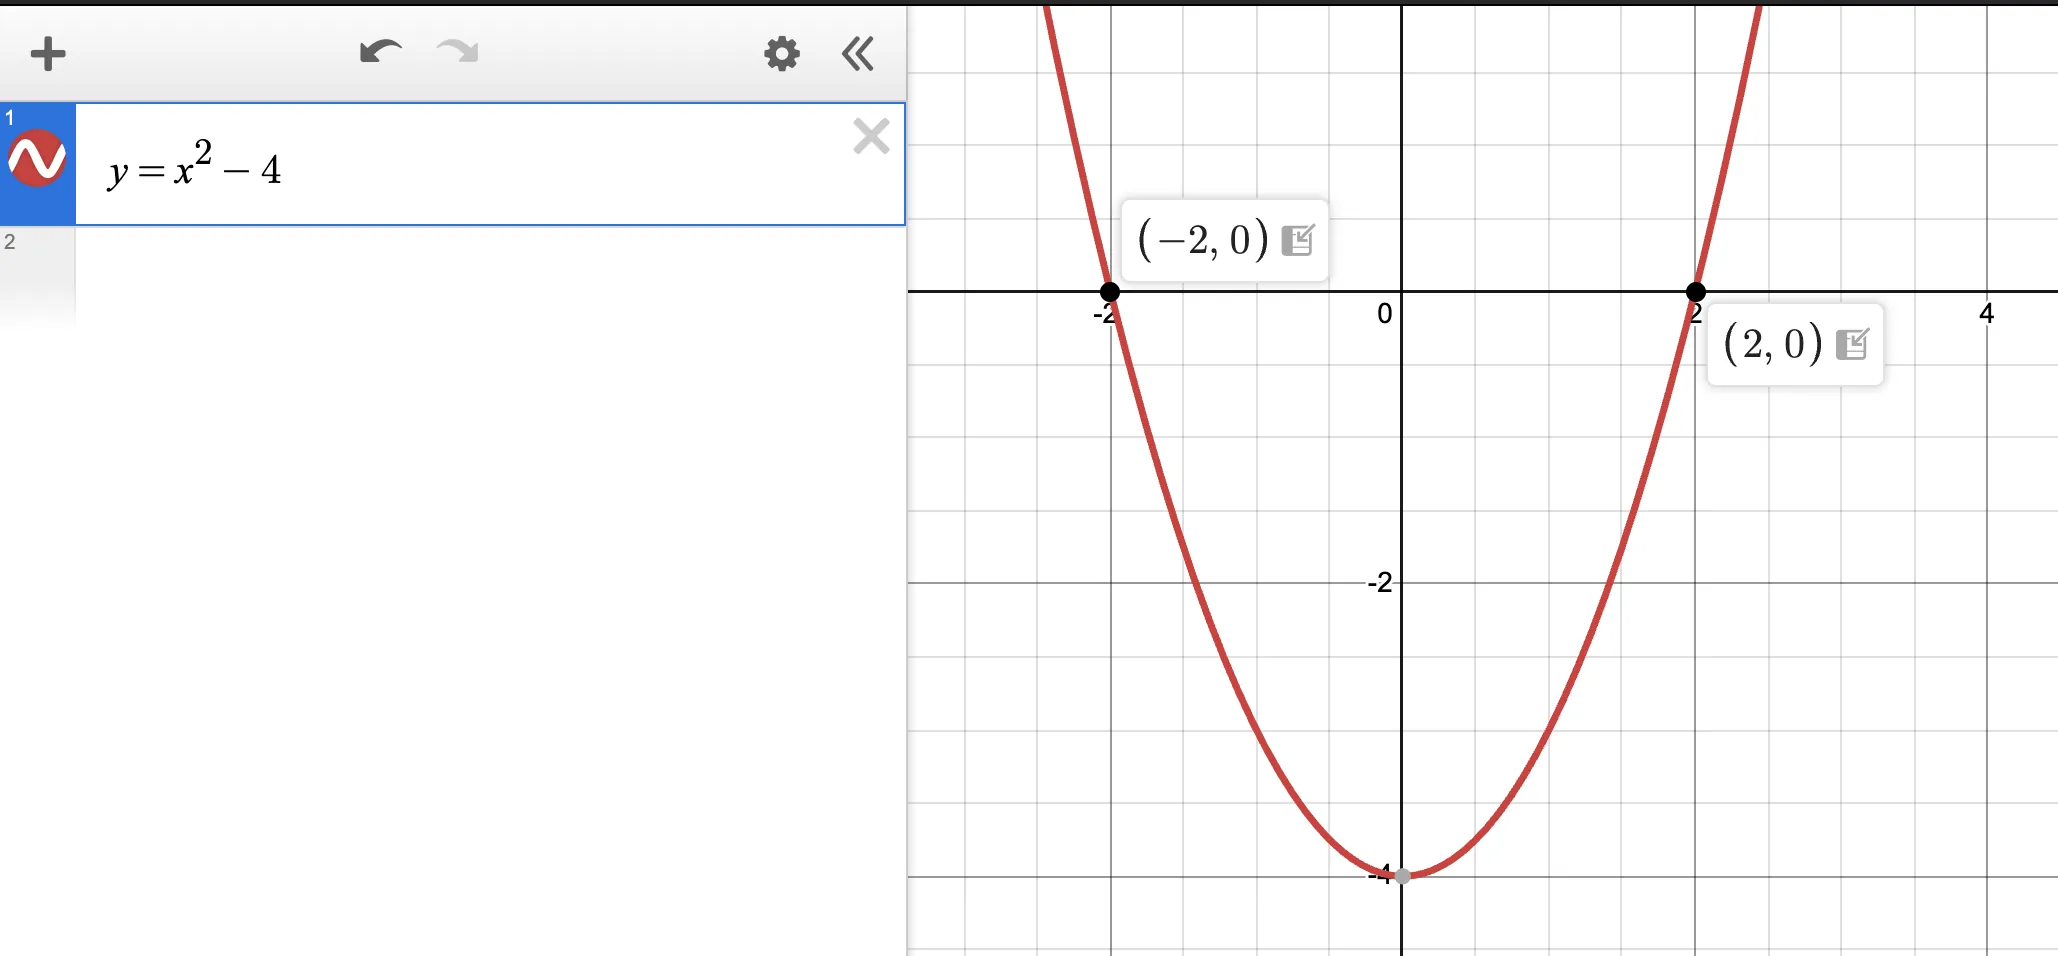
In Desmos: type the equation, find where the curve crosses the x-axis, click each point, read the x-coordinate. The y-coordinate will be 0 at every root, confirming you've clicked the right spot.
This also works for "how many real solutions" questions — graph the quadratic and count how many times it touches the x-axis: 0, 1, or 2 times.
3. Vertex and axis of symmetry
Questions asking for the vertex of a parabola or the axis of symmetry are instant in Desmos.
Type the quadratic. Click the lowest point (minimum) or highest point (maximum). Desmos labels it with exact coordinates. The x-coordinate is the axis of symmetry. The y-coordinate is the minimum or maximum value.
This sidesteps both the vertex form conversion and the x = −b/2a formula entirely.
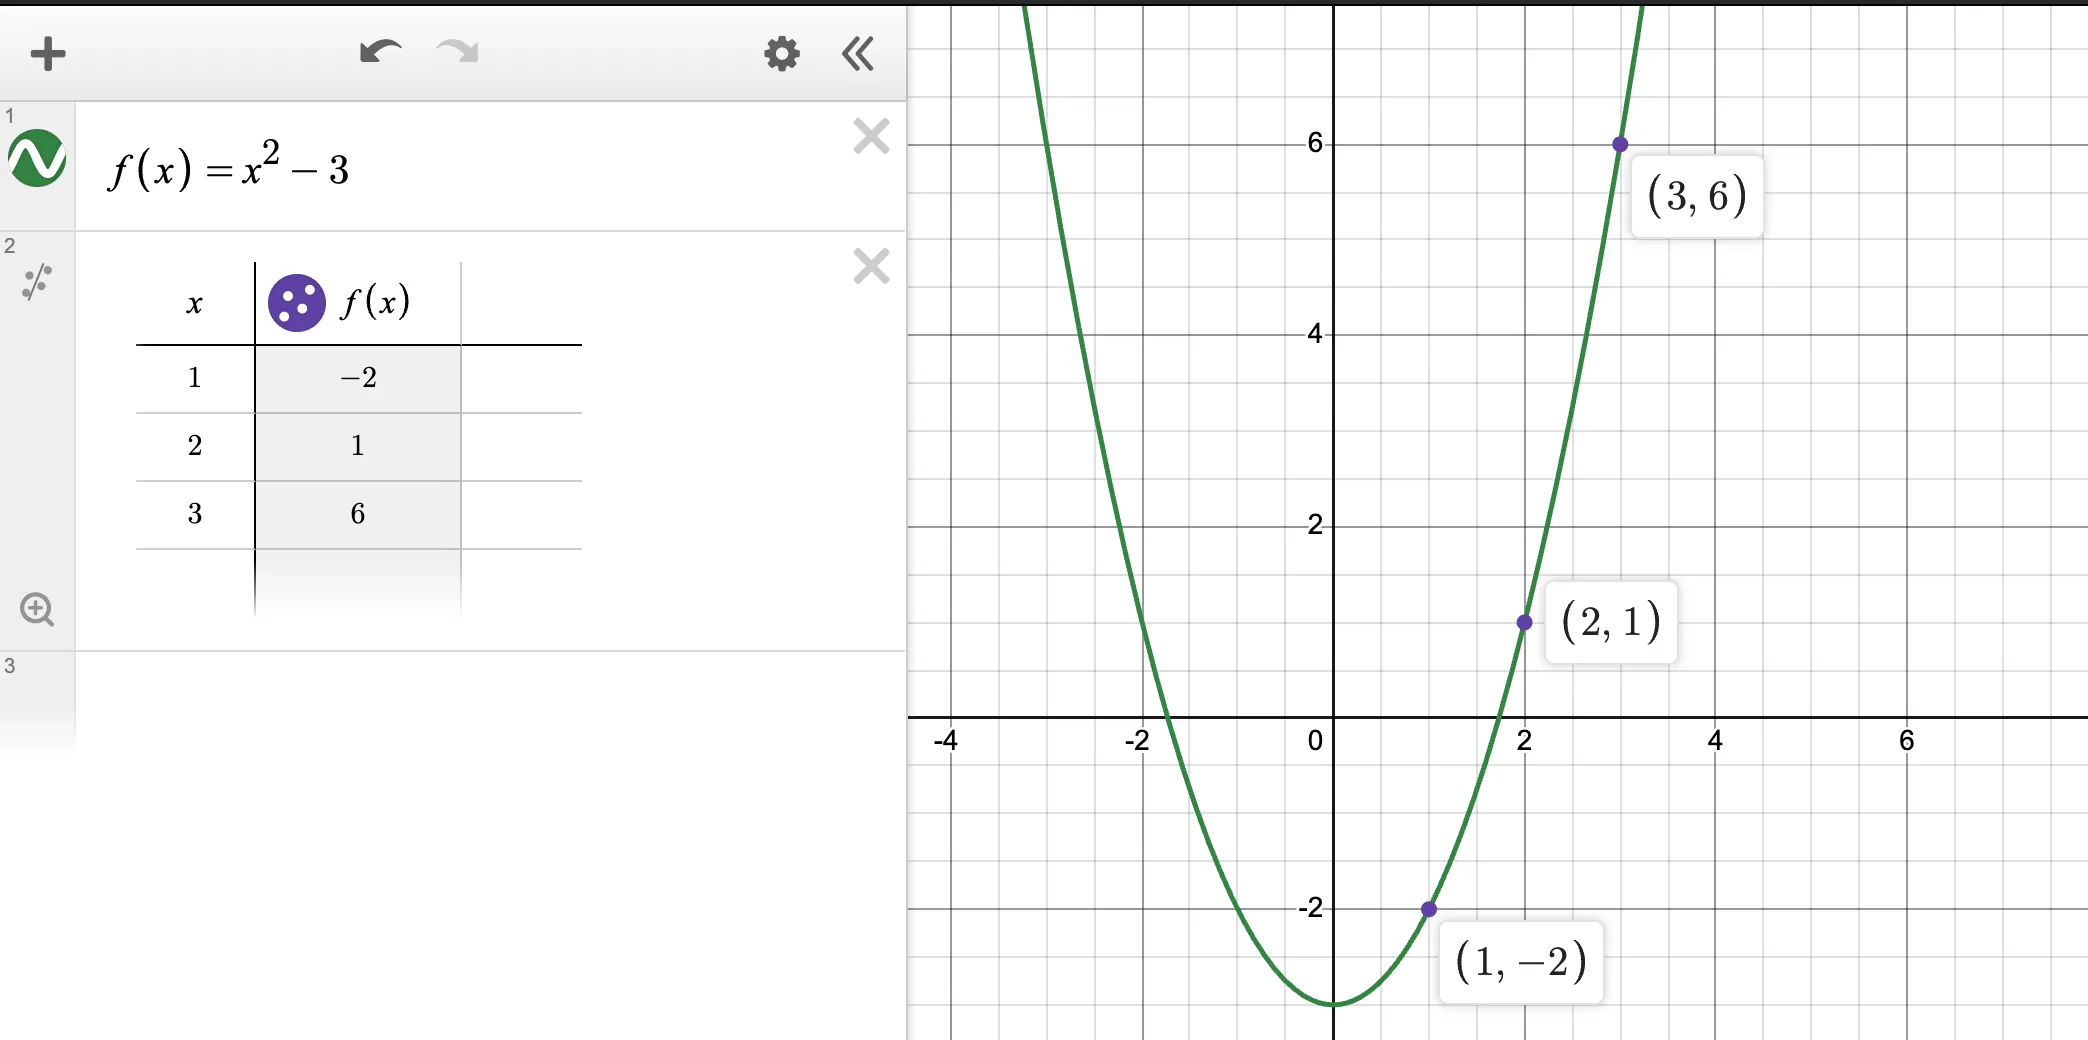
4. Evaluating functions
When a question asks for f(3) given a complex function, the long way is to substitute x = 3 and compute by hand. The Desmos way: type the function, then type (3, f(3)) or simply evaluate at x = 3 using a table.
Even simpler: for multiple-choice questions, type the function, then look at the table of values (click the table icon in Desmos) to find the exact output for any input.
5. Checking answer choices (back-substitution)
On multiple-choice questions where you're unsure of your algebraic answer, Desmos can confirm or eliminate options in seconds.
Method: for each answer choice, substitute the values back into the original equation and check whether Desmos shows the relationship holds. Alternatively, if the answer choices are coordinates, plot them and see which one lies on the curve.
This works particularly well for:
- Systems of equations (does this (x, y) pair satisfy both equations?)
- Quadratic solutions (are these the actual roots?)
- Function values (does f(a) really equal b?)
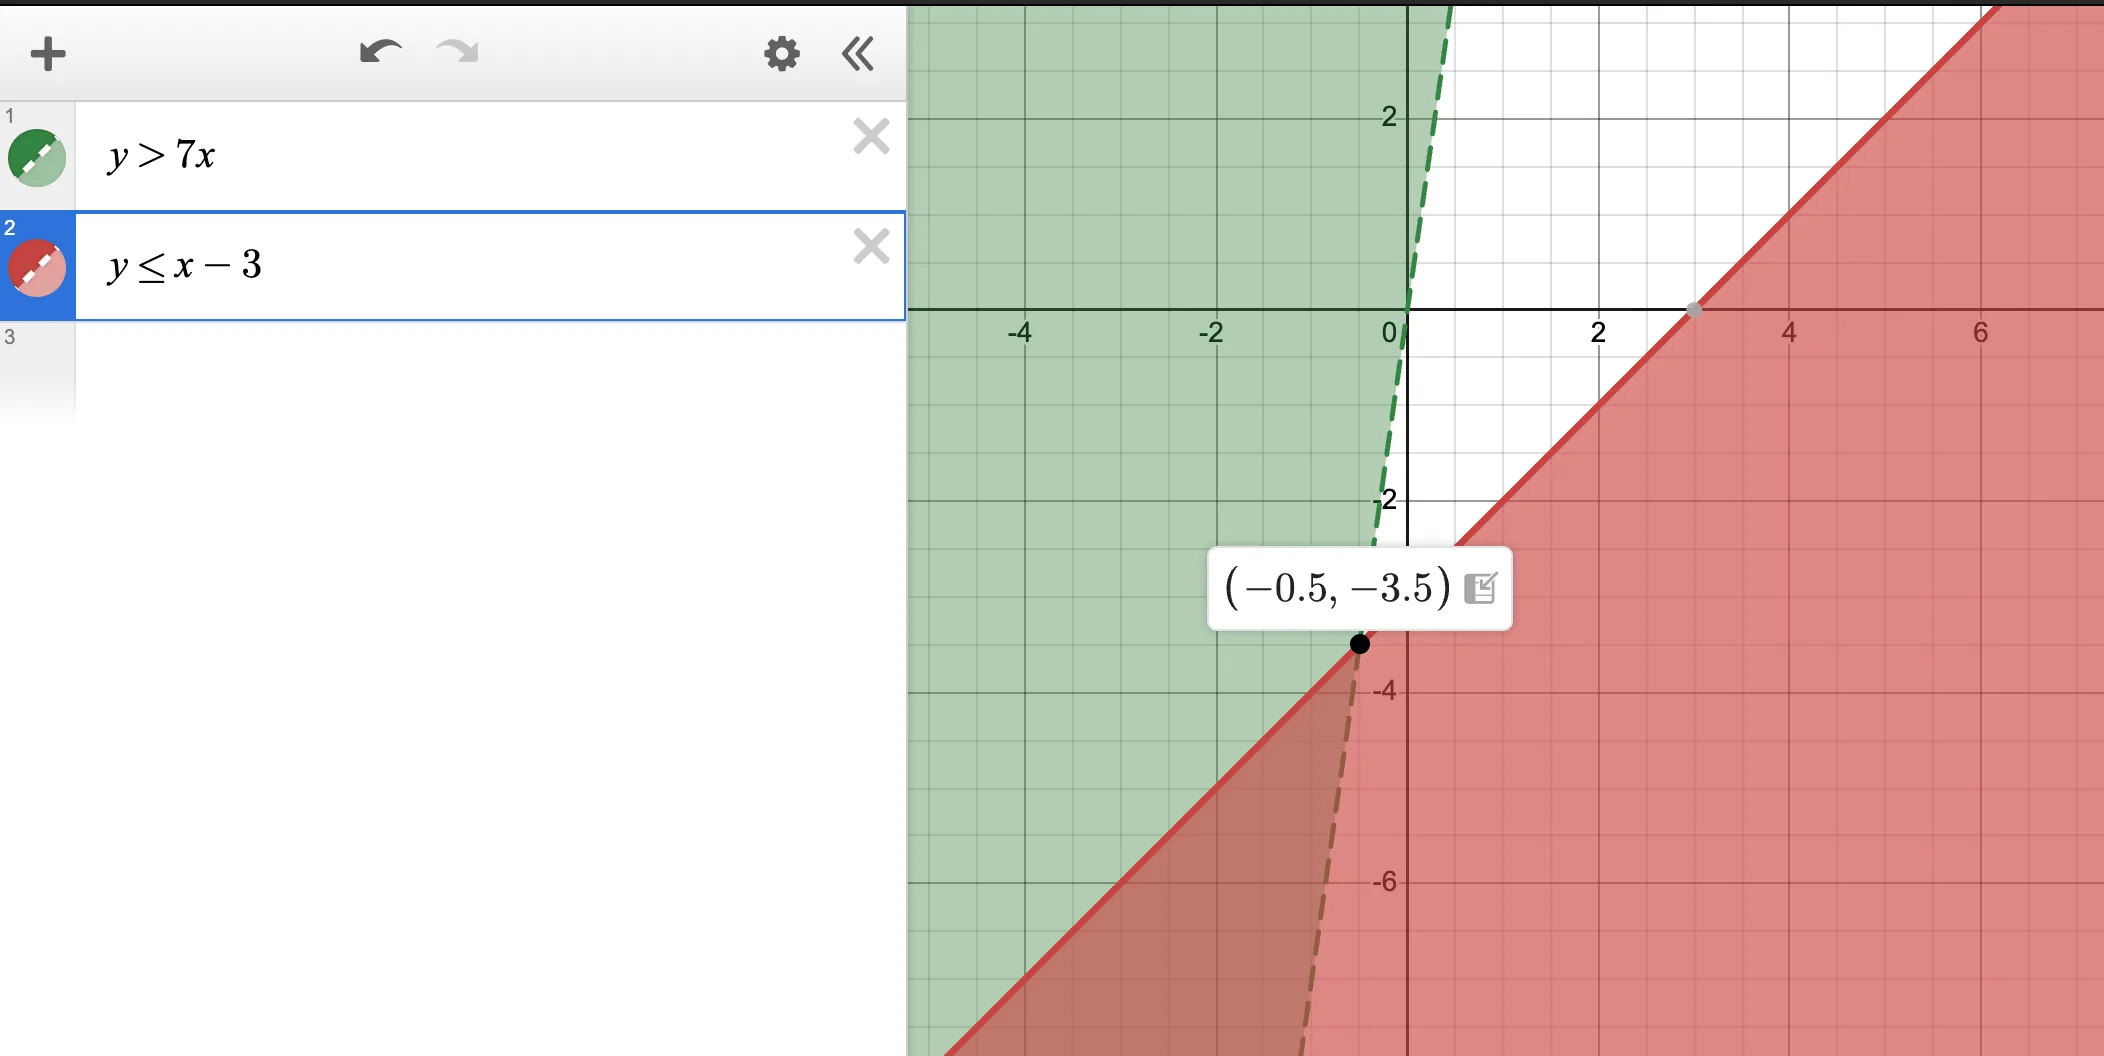
6. Inequalities and shaded regions
Systems of inequalities produce shaded regions on a graph. SAT questions sometimes show a shaded graph and ask which system of inequalities it represents — or give a system and ask which point satisfies it.
In Desmos, type an inequality (e.g. y > 2x + 1) and it shades the valid region automatically. Type two inequalities and it shades their intersection. Then check whether specific points fall in the shaded area.
What Desmos cannot replace
Desmos is powerful but not universal. There are question types where it helps less, or not at all:
Student-produced response (grid-in) questions — you have to type a specific numerical answer. Desmos can still help you get there, but you can't just "read" a multiple-choice option.
Word problems requiring equation setup — Desmos can't read the problem and write the equation for you. You still have to translate the English into math before Desmos can do anything.
Algebra manipulation questions — when the SAT asks you to "simplify" or "rewrite" an expression, graphing doesn't give you the rewritten form. You need algebraic fluency here.
Questions testing pure conceptual understanding — "which of the following statements about f(x) is true?" often requires understanding what the function is doing, not just graphing it.
Exact symbolic answers — Desmos gives decimal approximations for irrational numbers. If the answer choices are in the form (1 + √5)/2, you may need to recognize that 1.618... equals that expression.
The rule of thumb: if a question asks what value or how many, Desmos probably helps. If it asks why or which expression, you need algebraic reasoning.
The five Desmos habits that separate high scorers
1. Practice Desmos before the test — not during
Desmos is intuitive but not instant. If you've never graphed a system of equations in it, test day is the wrong time to figure out the interface. Spend 30–60 minutes before your test just playing with it: graph parabolas, find intersections, explore the table feature. Make the interface automatic so you're not thinking about how to use it when you're under time pressure.
The Desmos calculator used on the SAT is identical to the free one at desmos.com/calculator. Practice there.
2. Use it for multiple-choice, be more selective for grid-in
On multiple-choice questions, Desmos almost always helps — even if only to confirm your algebraic answer. On grid-in questions, weigh the setup time against the benefit. If you can solve it quickly in your head, do that. If the setup is complex, use Desmos.
3. Click points, don't estimate
Desmos shows exact coordinates when you click on a curve feature — intersection, root, vertex, or any plotted point. Always click. Eyeballing coordinates leads to errors. The click takes one extra second and removes all ambiguity.
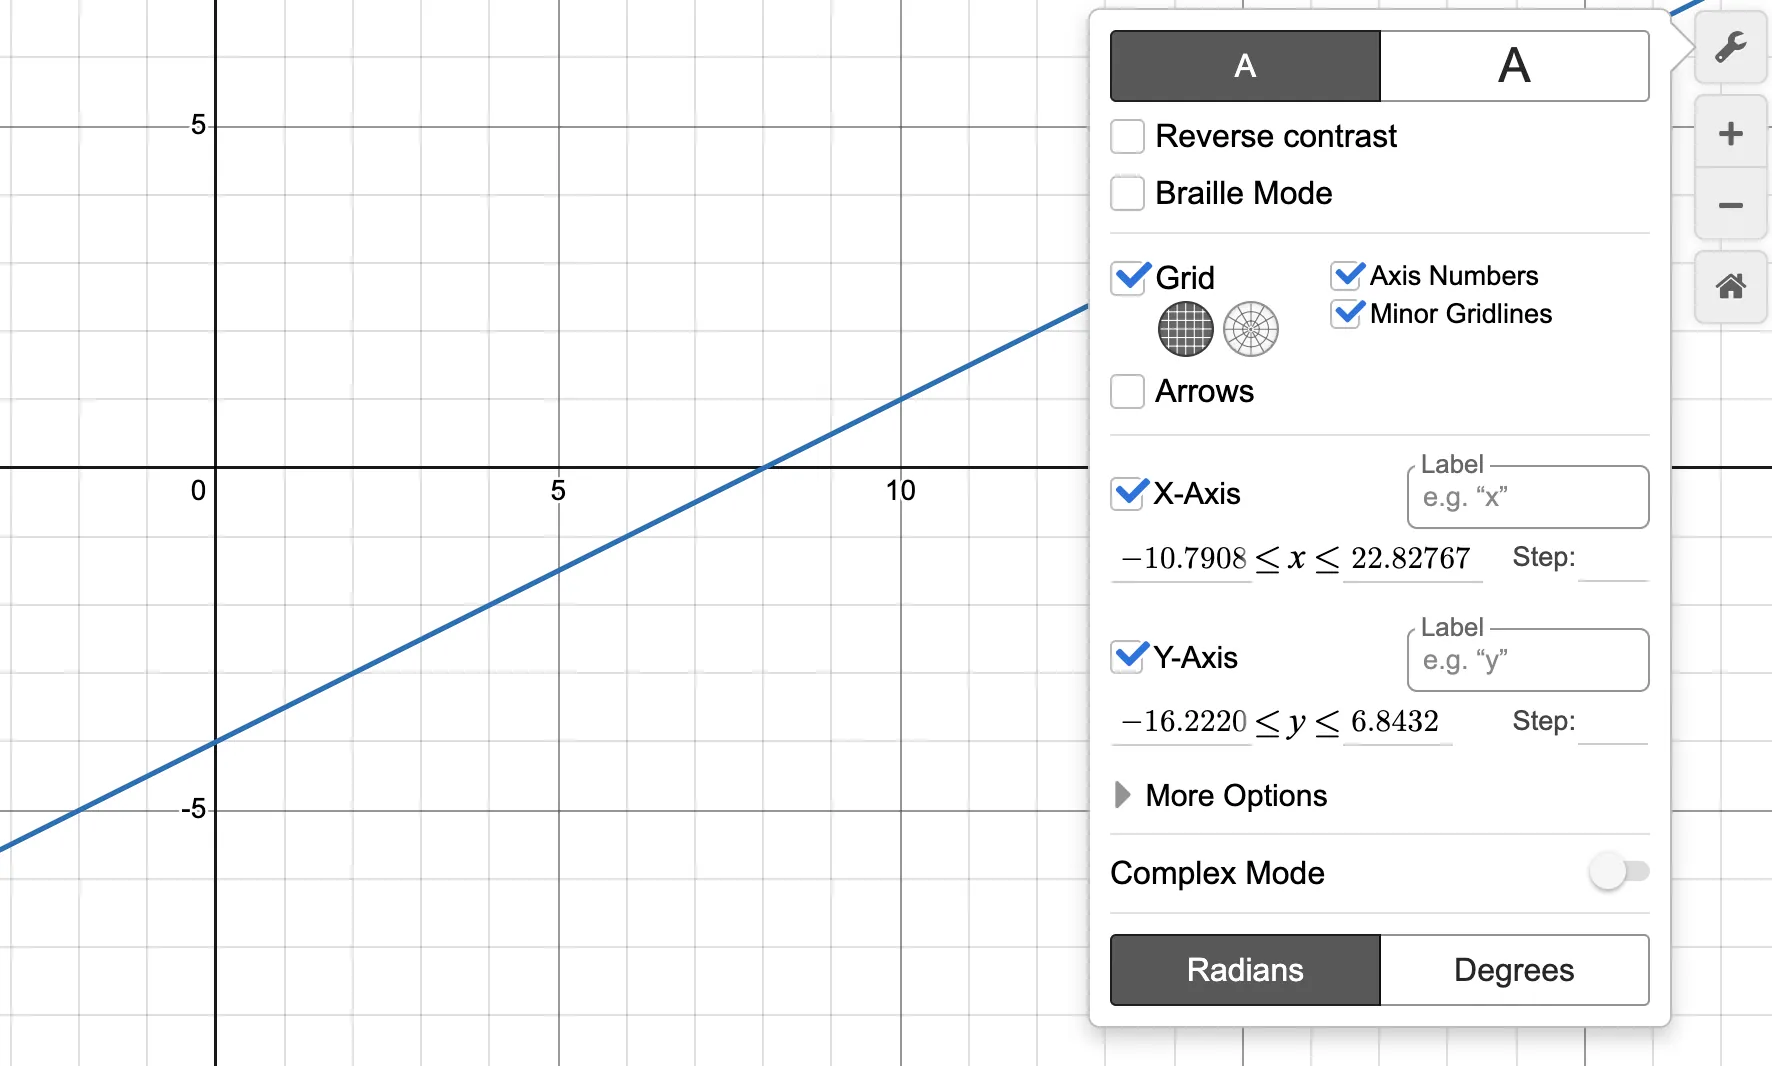
4. Use the zoom and window controls
Sometimes your graph won't show the relevant features because the intersection is far from the origin or the parabola's vertex is outside the default view. Use the + and − zoom buttons, or pinch to zoom on a touchscreen, to find the relevant region. You can also set the window manually using the wrench icon.
5. Type carefully — garbage in, garbage out
Desmos graphs exactly what you type. A mistyped coefficient or a missing parenthesis produces a completely different graph. Always double-check that what you typed matches the equation in the question. This takes 3 seconds and prevents a lot of pain.
Common typos to watch for:
2x+3vs2(x+3)— very differentx^2+3x-4— make sure the caret^is used for exponents, not*- Negative signs: use the
−from the keyboard, not a dash
A Desmos practice routine
The fastest way to build Desmos fluency is to do it deliberately, not accidentally.
Week 1: Open Desmos and graph every quadratic you encounter in practice problems. Find roots, vertex, and axis of symmetry by clicking — don't calculate them first. Compare what Desmos shows to what you'd get algebraically.
Week 2: For every systems-of-equations problem in your practice sets, solve it algebraically AND graphically. Compare the time and accuracy. You'll quickly see where Desmos saves the most time.
Week 3 onward: In timed practice, use Desmos on any multiple-choice question involving a graph, a system, a quadratic, or a function evaluation. Track which question types you're solving faster with it.
By test day, reaching for Desmos should be a reflex — not a decision.
Bringing it together
Desmos doesn't replace mathematical understanding. You still need to know what a system of equations is, what a root means, what a vertex represents. But once you have that understanding, Desmos lets you answer the question in a fraction of the time — with less risk of arithmetic error.
Combined with the two-pass strategy (flag hard questions, answer easy ones first, return with remaining time), Desmos frees up enough time in Math to be genuinely transformative on your score.
For the content foundation underneath the Desmos strategy — the algebra, quadratics, and functions you need to understand before graphing them — read our SAT Math prep guide.
For daily drills that build the math fluency Desmos amplifies, LockedIn delivers curated SAT math problems straight to your inbox — free, every day, on your schedule.
Start for free at lockedin.study →
Quick reference: Desmos on the SAT
| Question type | Desmos move | Time saved |
|---|---|---|
| Linear system | Graph both, click intersection | ~2 min |
| Nonlinear system | Graph both, click intersections | ~3–4 min |
| Quadratic roots | Graph, click x-intercepts | ~1–2 min |
| Vertex / axis of symmetry | Graph, click min/max point | ~1 min |
| Number of real solutions | Graph, count x-intercepts | ~1 min |
| Function evaluation | Type function, use table view | ~1 min |
| Inequality region | Type inequality, check shading | ~1 min |
| Answer verification | Substitute choice, check graph | ~30 sec |
Related: SAT math prep: the only algebra guide you need Related: Digital SAT adaptive format explained: how to use it to your advantage Related: How to study for the SAT effectively: the no-BS blueprint
LockedIn is a nonprofit SAT prep platform — free forever, built for students who are serious about their score. Get started at lockedin.study.
Enjoyed the read?
Join 10,000+ students getting elite SAT drills every morning at 5:00 AM.